Monitoring
This page outlines how to set up monitoring for the GRR components and for Fleetspeak. GRR and Fleetspeak keep track of many metrics which can be used to create charts about their performance, health, and workload.
When Monitoring.http_port is configured, each GRR component exports
metrics at http://<host>:<port>/metrics. The export is human-readable
plain-text and follows the Open Metrics standard.
More importantly however, Prometheus can parse the metrics,
and Grafana can plot the parsed data.
Prometheus Setup
This example will walk you through a basic Prometheus setup. For this example, the GRR Frontend, Worker, and Admin UI will be launched on your local machine. You can also choose to monitor Fleetspeak servers; otherwise feel free to skip the relevant steps, which are marked as FS.
Install GRR, for example from pip.
Run the GRR components locally. Execute each of the three commands in a separate terminal:
# Fleetspeak monitoring is configured in a separate config file.
grr_server --component fleetspeak_server

grr_server --component admin_ui -p Monitoring.http_port=44451

grr_server --component frontend -p Monitoring.http_port=44452

grr_server --component worker -p Monitoring.http_port=44453
Note: Custom monitoring port assignment is only required because the ports would clash when running multiple GRR components on one machine. Prometheus requires to know which type of component listens on which ports. If you use
Monitoring.http_port_max, make sure that only one type of GRR components (e.g. only workers) listen on a given range of ports.FS: Edit the file
server.components.config. It is located in/etc/fleetspeak-serveron a setup installed from a DEB and in the virtualenv, infleetspeak-server-bin/etc/fleetspeak-serverwhen running from a virtualenv. Add the following to the end of the file:stats_config: < address: "localhost:54451" >This will insure that Fleetspeak will export its metrics to Prometheus in http://localhost:54451/metrics.
Open http://localhost:44451/metrics in your browser. You should see a plain-text list of metrics.
Install Prometheus, e.g. by downloading and unpacking the archive file.
Configure Prometheus to scrape GRR. Save the following configuration as
prometheus.ymlin the Prometheus folder.global: scrape_interval: 15s scrape_configs: - job_name: 'grr_admin_ui' static_configs: - targets: ['localhost:44451'] - job_name: 'grr_frontend' static_configs: - targets: ['localhost:44452'] - job_name: 'grr_worker' static_configs: - targets: ['localhost:44453']
FS: under
scrape_configsalso add the following:- job_name: 'fleetspeak' static_configs: - targets: ['localhost:54451']
Start Prometheus, by running the following command from the Prometheus folder:
./prometheus --config.file=prometheus.ymlOpen http://localhost:9090/targets in your browser. After a couple seconds, you should see three (FS: four) targets (
grr_admin_ui,grr_frontend,grr_worker), each having 1 instance up.Open the Expression Browser by clicking on Graph (http://localhost:9090/graph). On this page, click on the Graph tab (next to Console). Then, try any of the example queries to query GRR metrics. Be aware that you might only see very few data points, very low values, or no data at all since GRR is not under any real workload and has 0 connected clients in this example.
At this point, you can use Prometheus to display basic charts using the expression browser. We recommend the usage of a dedicated visualization software, e.g. Grafana. You can set up a quick configuration of Grafana to scrape the metrics from Prometheus by setting up Grafana.
Example Queries
To get you started, this page contains some example queries. These queries give you a good insight on GRR’s health and workload.
QPS rate for the Frontend
rate(frontend_request_count_total{job="grr_frontend"}[1m])
Latency for requests to the Frontend
rate(frontend_request_latency_sum{job="grr_frontend"}[5m]) /
rate(frontend_request_latency_count{job="grr_frontend"}[5m])
Active Tasks running on the Frontend
frontend_active_count
Rate of successful flows on the Worker
rate(grr_flow_completed_count_total{job="grr_worker"}[5m])
Rate of failed flows on the Worker
rate(grr_flow_errors_total{job="grr_worker"}[5m])
Threadpool latency in the Worker
rate(threadpool_working_time_sum{job="grr_worker"}[5m]) /
rate(threadpool_working_time_count{job="grr_worker"}[5m])
Threadpool queueing time in Worker
rate(threadpool_queueing_time_sum{job="grr_worker"}[5m]) /
rate(threadpool_queueing_time_count{job="grr_worker"}[5m])
Number of outstanding tasks in the Worker
threadpool_outstanding_tasks{job="grr_worker"}
Number of threads running on the Worker
threadpool_threads{job="grr_worker"}
Rate of client crashes reported to the Worker
rate(grr_client_crashes_total{job="grr_worker"}[5m])
Scaling Prometheus
Prometheus supports automatic Service Discovery for many types of infrastructure. Depending on your hosting setup and size of your GRR installation, this can be an improvement over manually hardcoding hostnames in the Prometheus configuration.
Prometheus Security Considerations
A minimal HTTP service, based on
prometheus_client
is listening at Monitoring.http_port for each GRR component. This HTTP
service exports read-only metrics under /metrics and /varz and does
not enforce any access control. People with access to it can read
aggregated metrics about your GRR installation. With these metrics, facts
about the number of workers, flow activity, and service health can be
derived. Make sure to limit access to the port, for example by employing
a firewall. Furthermore, read Prometheus Security.
Grafana Setup
This example will walk you through setting up Grafana as a dedicated visualization software to parse, display and query metrics scraped from GRR server components by Prometheus. If you’ve followed the example setup before, then Prometheus is configured to scrape GRR (and Fleetspeak as well if you have a Fleetspeak-based deployment). You will also be able to set up a simple alerting system using Grafana. These instructions assume that GRR server and Prometheus are both up and running.
Install Grafana by following the instructions:
sudo apt-get install -y apt-transport-https
sudo apt-get install -y software-properties-common wget
wget -q -O - https://packages.grafana.com/gpg.key | sudo apt-key add -

sudo add-apt-repository "deb https://packages.grafana.com/oss/deb stable main"

sudo apt-get update
sudo apt-get install grafana
This will install the latest OSS release.
After Grafana is installed, you can start the Grafana server by executing in a terminal (assuming your operating system either Debian or Ubuntu and you installed the latest OSS release):
sudo systemctl daemon-reload
sudo systemctl start grafana-server
sudo systemctl status grafana-server
This will get the Grafana server up and running on
http://localhost:3000.Grafana is now set up and can be visited at
http://localhost:3000. The username and password should be “admin”; please change it. If the Grafana UI doesn’t show up, either the installation of Grafana or the server run failed; make sure to check the official documentation.Set up Prometheus as a data source for Grafana, so that Grafana can display the metrics from Prometheus. To do that, follow the these instructions: Click on Configuration -> Data Sources in the Grafana server UI, then click on the “Add data source” button. From the list of “time series databases”, choose Prometheus and in the Name field type
grr-server.Grafana is set up and ready to show metrics scraped by Prometheus. You can start by either creating your own dashboards or importing exisiting dashboards into Grafana. The next step would be to import dashboards provided with GRR from the Grafana folder in GRR repository. You can customize and expand them with additional graphs, if needed. These dashboards contain some example graphs of metrics scraped by Prometheus, and also implement sample alerts. To do that, first download the dashboards from the repository (download dashboards from
fleetspeak_enabled_setup/dashboards_for_useorlegacy_setup/dashboards_for_use, depending on your deployment), and then head over tohttp://localhost:3000/dashboard/import. There, you can click ‘Upload .json file’ and upload the dashboard you have downloaded from the repository. The dashboard is now imported; you can access it by going tohttp://localhost:3000/dashboardsand clicking the dashboard’s name, e.g “Frontends Dashboard”. Each of the sample dashboards correspond to a different component of GRR server (and Fleetspeak server itself), e.g the Frontends Dashboard shows aggregated metrics from all Frontends that are active in GRR server. Each of the dashboards contain several panels; each such panel consists of a graph that contain one or more metrics queried from Prometheus, and possibly alerting rules.You can now use the dashboards. The dashboards can give a general overview over the main components of the GRR server and Fleetspeak servers, which can be utilized by the user to monitor different metrics of each component. Examples for such metrics can be found in the examples above. Remember that the dashboards and alerts are flexible, and can be expanded or modified to adjust to your exact needs. Additional metrics can be used by exploring
http://<host>:<port>/metricsfor each component of GRR server (change the port according to the GRR server component you want) and Fleetspeak servers, and if you’d like to create your own custom dashboards, panels and alerts, make sure to go over the corresponding documentation in Grafana.
Alerts
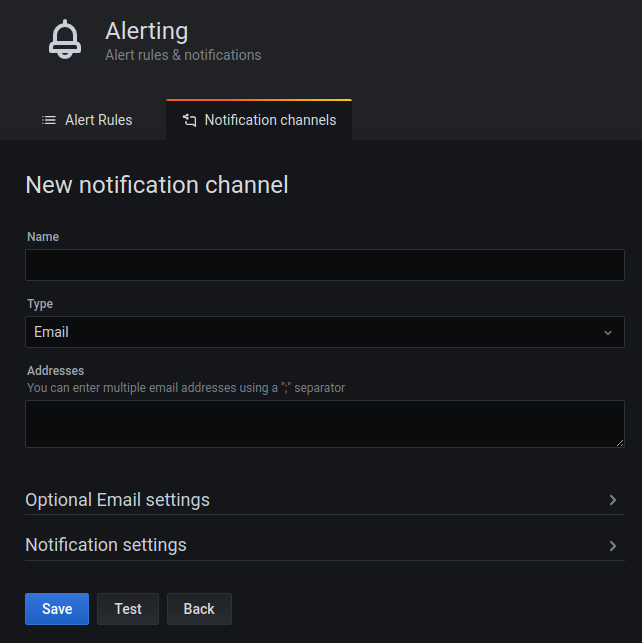
If you want to use the alerts in Grafana, you first need to define a
notification channel
for the alerts. This can be done by heading over to
http://localhost:3000/alerting/notification/new and
following the form
to add a notification channel. For reference, check out the screenshot
that follows.
Once a notification channel is set up,
you will start receiving alerts from the existing dashboards, as those
contain definitions for simple alerts. There are two sample alerting
rules: in each dashboard, there is a panel that counts the number of
active processes for the specific job. For example, in the Workers
dashboards, there is a panel called “Active Processes” which shows
the current number of active Workers processes. If the number of active
workers is zero - an alert will be fired. If you want to disable or
remove an alert, go to the dashboard and the corresponding panel,
and there you can remove the alerting rule.
Monitoring Client Load Stats
Using Grafana, you are able to view statistics of individual GRR clients and monitor them. To achieve this, check out the following steps.
Note that this is only applicable to Fleetspeak-based GRR deployments, as the individual client data using these steps is gathered from the underlying Fleetspeak client, unlike the current GRR Admin UI which gathers its client data from the GRR clients instead.
Set up Grafana, until at least step 3. At this point, you should have a running instance of Grafana server.
Run GRRafana HTTP server by
grr_server --component grrafana. Briefly, this server is a component of GRR which serves Grafana clients’ stats data from GRR, through the gRPC connection between GRR and Fleetspeak. For more details, check out google/grr#832. It should run by default on port 5000.Install JSON Datasource plugin by using the command:
grafana-cli plugins install simpod-json-datasource. The plugin will issue JSON requests from Grafana to the HTTP server, and then display the queries’ results. Make sure that the url ishttp://<host>:5000, and for a more friendly name than ‘JSON’, feel free to rename the data source to ‘grrafana’.After the server is up and running, if you do not want to create your own Grafana monitoring dashboards for individual client monitoring, we got you. In the sample dashboards in step 3, you can also find a sample dashboard called Client Load Stats for this exact purpose and import it as explained in step 5 here.
If you want, you can create Grafana dashboards or extend the sample dashboards to query individual clients. To do that, create a new dashboard (clicking on ‘+’ -> Dashboard), then click on Dashboard Settings on the top-right and add a new variable. Name the new variable
ClientID(this name must be precise, with correct capitalization as well, in order for it to be identified correctly) and specifiy its type as “Constant” (and make sure to not hide the variable or the label, so that it’s visible in the dashboard). At this point, you should have an empty dashboard with an empty textbox namedClientIDabove your panels. Feel free to create new panels and playing around with all the individual statistics information** you can get from your clients!
Aggregated Clients Statistics
In GRR Admin UI you are able to view aggregated statistics for multiple GRR clients, such as an OS breakdown, GRR version breakdown and so on. To see those statistics, on GRR Admin UI, under the ‘Management’ section on the menu, enter ‘Statistics’. Similarly to Client Load Stats, you may choose to view this information using Grafana.
To achieve this, follow these steps:
Follow the steps in Client Load Stats until at least step 3. At this point, you should have a Grafana instance up and running, the JSON Datasource plugin installed and configured, and the GRRafana HTTP server (as discussed in google/grr#832) is up and running.
You can now fetch aggregated clients statistics, which are named on a similar convention to the metrics gathered in the current GRR Admin UI, such as “OS Release Breakdown - N Days Active” and so on. Note that we do not provide sample dashboards for these metrics as they are table-based and cannot be manipulated too much. Therefore, you can make a panel that consists of a single metric alone by just selecting it on the dropdown box named “Metric” while creating the new Grafana panel.